
Gold Nanoparticles Properties, Applications, Handling, Processing and Calculation Tools
Here we have compiled a one stop complete reference for all things relating to gold nanoparticles
After manufacturing and measuring the properties of over two thousand lots of SGNPs, along with tens of thousands of conjugated orders, we have compiled the information most sought by customers.
Table of Contents
Sizes and Colors of GNPs and Nanoclusters
Gold Nanoparticle Surface Areas
Gold Nanoparticle Concentrations
Gold Nanoparticle Molar Extinctions
Sizes and Colors of GNPs and Nanoclusters
SGNPs (SGNPs) are manufactured using a proprietary seed based method, where a 1.8 nm seed is slowly grown in a growth solution to selective diameters up to 1.5 microns in diameter.
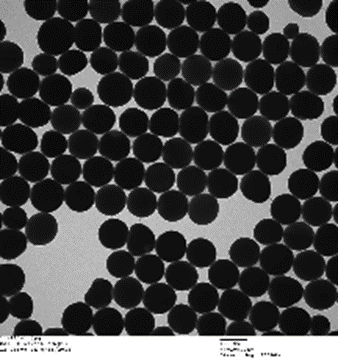
Figure. TEM of 100nm SGNPs
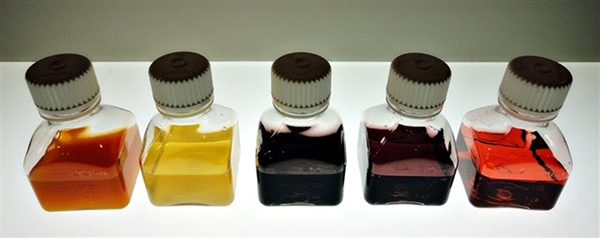
Figure. Picture of Gold Nanoclusters of sizes (L-R) 0.8nm, 1.2nm, 1.8nm, 2.2nm, and 4nm
We define SGNPs as such for sizes from 5nm and greater and refer to the sizes from 1.8nm to 4nm as nanoclusters since they have a defined specific Au atom count and mass. The following table shows the physical properties of the gold nanoclusters:
| Diameter (nm) | Weight (kDa) | Au Atom Number | Color |
|---|---|---|---|
| 0.8 | 5 | 25 | Orange |
| 1.2 | 8 | 38 | Honey |
| 1.4 | 15 | 68 | Green |
| 1.8 | 22 | 102 | Coffee |
| 2.2 | 29 | 144 | Coffee |
| 4 | 93 | 470 | Red |
GNPs (nanoparticles > 4nm) can be red for the smaller sizes and for the larger sizes the color depends on whether you are looking at scattering or absorption, as these nanoparticles exhibit dichroism.
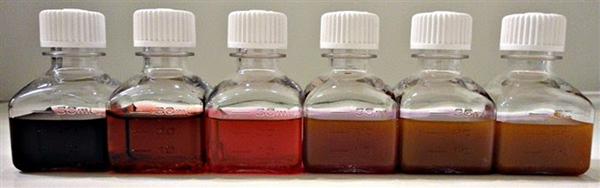
Figure. Picture of GNPs in water (L-R) 5nm, 10nm, 30nm, 80nm, 90nm, and 150nm
The differences in color are due to the absorbance of the GNPs which change as a function of diameter a shown in the following figure.
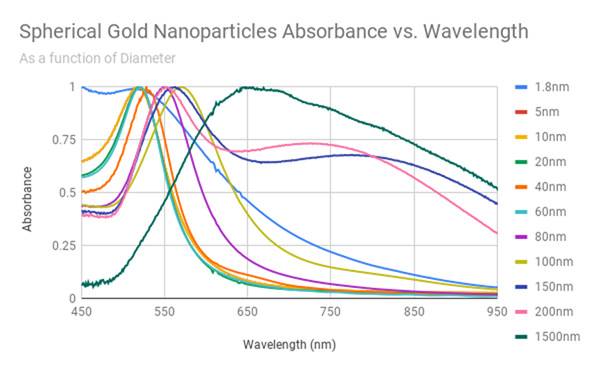
Figure. SGNPs Absorbance vs. Wavelength
Gold Nanoparticle Surface Areas
Studies of surface area for the GNPs as a function of size are shown in the following table:
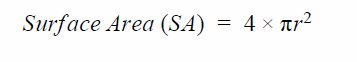
Table. SGNP Surface Areas as a Function of Diameter
Diameter (nm) |
Surface Area (nm2) of 1 nanoparticle | NPS in 1mL at OD=1 | NPS * Surface Area (nm2) |
| 1.8 | 10 | 8.51E+14 | 8.66E+15 |
| 2.2 | 15 | 4.66E+14 | 7.08E+15 |
| 3 | 28 | 1.84E+14 | 5.19E+15 |
| 4 | 50 | 7.75E+13 | 3.90E+15 |
| 5 | 79 | 3.97E+13 | 3.12E+15 |
| 10 | 314 | 4.96E+12 | 1.56E+15 |
| 15 | 707 | 1.47E+12 | 1.04E+15 |
| 20 | 1,256 | 6.20E+11 | 7.79E+14 |
| 25 | 1,963 | 3.18E+11 | 6.23E+14 |
| 30 | 2,826 | 1.84E+11 | 5.19E+14 |
| 35 | 3,847 | 1.16E+11 | 4.45E+14 |
| 40 | 5,024 | 7.75E+10 | 3.90E+14 |
| 45 | 6,359 | 5.45E+10 | 3.46E+14 |
| 50 | 7,850 | 3.97E+10 | 3.12E+14 |
| 55 | 9,499 | 2.98E+10 | 2.83E+14 |
| 60 | 11,304 | 2.30E+10 | 2.60E+14 |
| 65 | 13,267 | 1.81E+10 | 2.40E+14 |
| 70 | 15,386 | 1.45E+10 | 2.23E+14 |
| 75 | 17,663 | 1.18E+10 | 2.08E+14 |
| 80 | 20,096 | 9.69E+09 | 1.95E+14 |
| 85 | 22,687 | 8.08E+09 | 1.83E+14 |
| 90 | 25,434 | 6.81E+09 | 1.73E+14 |
| 95 | 28,339 | 5.79E+09 | 1.64E+14 |
| 100 | 31,400 | 4.96E+09 | 1.56E+14 |
| 150 | 70,650 | 1.47E+09 | 1.04E+14 |
| 200 | 125,600 | 6.20E+08 | 7.79E+13 |
| 500 | 785,000 | 3.97E+07 | 3.12E+13 |
| 1000 | 3,140,000 | 4.96E+06 | 1.56E+13 |
| 1500 | 7,065,000 | 1.47E+06 | 1.04E+13 |
The second column in the table shows the surface area of one nanoparticle. The third column shows the number of nanoparticles at that size in 0.05mg of total gold. When multiplying these two columns, we get the total surface area of all the nanoparticles.
The surface area of 1mL of solution of 1.8nm GNPs is the equivalent surface area of a cellular phone!
This is one of the key benefits of GNPs - tremendous surface areas! The benefits from large surface areas are far reaching and can be applied to a number of different fields including biomedical from therapy, and diagnostics, to environmental, including filtering and remediation.
Gold Nanoparticle Concentrations
ICP-MS and its Measurement Relationship to Concentration
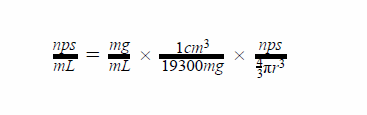
GNP concentration is calculated using ICP-MS and TEM. ICP-MS provides the amount of total gold. TEM then provides three sets of information that is used in a complex calculation: Average sphere size Number of spheres in the sample vs. other shapes Polydispersity Index (PDI) = std dev / avg size A simple calculation relating ICP-MS and TEM size would be:
ICP Mass in a given volume (mg/mL) = GNP concentration (nps/mL) X Gold density (mg/cm3) X Volume of 1 GNP (cm3/nps)
Or,
UV-VIS as a tool to measure concentration
We have found that only when the PDI is less than 10%, and when the % of spheres is greater than 98%, we can accurately use UV-VIS as a concentration measurement tool. So, for example, if the UV-VIS shows an OD=1 for 10nm SGNPs, we know Table 2, the concentration is ~5e12 nps/mL. If the OD is later measured as OD=2, we know the concentration is 10e12 nps/mL. Again, this is only true for GNP lots that have a PDI less than 10%, and very few nonspherical shapes.
Other concentration measurements and their calculation include:
Weight Concentration (wt. conc.) mg/mL = ICP measurement for a given volume
Parts per Million (ppm) = Wt. conc. (µg/mL)
Weight % = Wt. conc. (mg/mL / 1e6)
Molarity (µM) = nps/mL X 1e3mL/1L X 1mole/6e23nps X 1e6µmole/1mole
Gold Nanoparticle Molar Extinctions
One of the huge advantages of GNPs as a diagnostic are their molar extinction. Typical molar extinctions for different sizes compared to some popular fluorophores are shown in the following table:
| Molar Extinction (M-1cm-1) | Absorption (M-1cm-1) | Scattering (M-1cm-1) | Excitation fluorophore wavelength, peak extinction for SGNPs (nm) | Emission fluorophore wavelength, peak extinction for SGNPs (nm) | |
| 10nm SGNP | 1.21E+08 | 1.21E+08 | 0 | 519 | 519 |
| 50nm SGNP | 1.51E+10 | 1.45E+10 | 5.88E+08 | 531 | 531 |
| 100nm SGNP | 1.21E+11 | 5.82E+10 | 6.27E+10 | 569 | 569 |
| FITC Fluorophore | 7.00E+04 | 494 | 518 | ||
| CY3 Fluorophore | 1.50E+05 | 555 | 570 | ||
| CY5 Fluorophore | 2.50E+05 | 646 | 662 |
The extinction of a 100nm spherical GNP is seven orders of magnituge larger than a single FITC fluorophore!
Fluorescence vs. Extinction
Note the tremendous difference in molar extinction between GNPs and fluorophores. A single 100nm GNP is more than a million times more detectable than a single FITC fluorophore. But note the difference. Fluorophore fluorescence - that is there is an energy transfer where the emitted light is a different color (reduced energy or red shifted) than the incident light. GNPs on the other hand, absorb and scatter without any (appreciable) energy transfer. This of course changes the detection system. Whereas fluorescence microscopes are used for fluorophores, typically dark field microscopes that measure scatter, or photothermal microscopes that measure absorption are used to detect GNPs.
Note two important properties that will be discussed later in this overview. First, smaller GNPs, typically we define them as < 20nm do not scatter to any appreciable degree. They only absorb. Consequently measurement instruments like Dynamic Light Scattering or DLS that rely on scattering for measurement can not accurately measure the sizes of smaller GNPs. Second, large GNPs such as 100nm SGNPs are dichroic in nature. That is, they will appear yellow on scattering and purple on transmission. That is because the absorbance curve shown here with a peak at 569, works to scatter the light at 569nm when the light is behind the viewer. When viewing the material with the light from behind the sample, the absorbance curve transmits the colors not associated with the curve at 569nm. This is shown in the following figure.
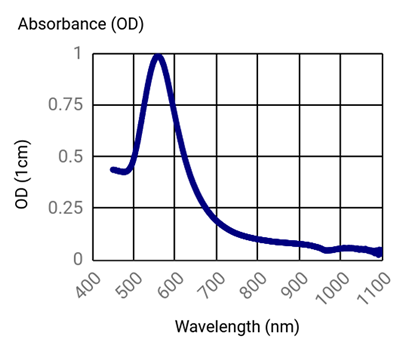
Figure. 100nm SGNPs Absorbance vs. Wavelength
How do I see them?
Of course nanoparticles are easily viewed through TEM and SEM. In fact In optical microscopy such as in brightfield and darkfield modes, Typically you cannot see them with fluorescence microscopes since they do not fluoresce. But there are exceptions. We sell fluorophore labeled GNPs that are used in a number of different applications including cell imaging, cell sorting, and diagnostics.