
DLS as a Gold Nanoparticle Characterization Method
Definition, Use, Limitations
Background
It is a well-known fact that particles have the ability to disperse light, which we experience every day when we see the blue sky. This is due to the particles in our atmosphere scattering blue light more strongly than red light. Similarly, the texture of a surface, whether it be glossy or matte, is also influenced by particles within it. By measuring factors such as the angle, frequency, and intensity of light scatter, we can gain insights into the size, charge, and molecular weight of various materials. This plays a crucial role in many of our modern technologies.
Light Scattering Techniques
Utilizing the principles of laser diffraction, X-ray diffraction, small angle X-ray diffraction (SAXS), and wide angle X-ray diffraction (WAXS), one is able to accurately measure light scattering in a wide range of angles with high sensitivity, allowing one to determine the size of particles and droplets in powders, emulsions, sprays, and suspensions. However, for particles on a nanometer scale, there is a significant decrease in light scattering. This means that even by reducing the wavelength of the light source, the most effective analysis may require alternative methods. Multiple theories such as Mie scattering theory, Fraunhofer scattering theory, and Rayleigh scattering theory can be used to determine particle size distribution. Additionally, an inversion algorithm can convert light scattering data into a size distribution.
By examining the nano material at different angles to the laser, we can observe the diffusion of particles and calculate their translational diffusion coefficient, which reveals their size. This process is referred to as nanoparticle tracking analysis (NTA). Additionally, by monitoring changes in scattered light over time as particles pass through it, we can determine the presence of fine or larger particles. This technique is commonly known as photon correlation spectroscopy or dynamic light scattering.
In electrophoretic light scattering, an electric field is applied to a liquid to induce movement in particles. The speed of the particles is directly related to their charge - the higher the charge, the faster they move. A laser is then passed through the particle solution and its scattered light is combined with an unaffected portion of the same laser. This creates an interference pattern which can be used to precisely determine the velocity of the particles.
By measuring light scattering at multiple angles and concentrations, we gain insights into the molecular weight and structure of the material being analyzed, whether it is made up of polymers or biopolymers.
DLS
DLS, also known as QELS, is a commonly used and non-invasive method for determining the size and size distribution of molecules and particles, usually in the submicron range.
Dynamic light scattering is commonly used to study particles, emulsions, and dissolved molecules in liquids. The movement of these suspended particles or molecules results in varying intensities of scattered laser light. By studying these fluctuations, the speed of Brownian motion and particle size can be determined through the application of the Stokes-Einstein relationship.
DLS Settings
On our Malvern Nano ZS we use the following settings:
Refractive index @ 633nm = 0.19552, setting = 0.2 Extinction Coefficient = 3.2582 Absorption 3.32
We use an OD between 0.1 and 1 and make sure that any dilution on a sample with an adsorbed ligand uses a concentration of ligand similar to what is listed on the COA.
We sonicate as per our How to sonicate gold nanoparticles.
We do not rely on DLS for any accurate sizing information for gold nanoparticles < 20nm, nor any shape other than spheres.
DLS Limitations
"DLS is of very limited use for accurate particle sizing of “real” samples and provides accurate results only for highly monodisperse samples (i.e., PDI < 0.1). Any deviation in particle polydispersity will result in a large deviation of DLS from the true particle size." Rationalizing Nanomaterial Sizes Measured by Atomic Force Microscopy, Flow Field-Flow Fractionation, and Dynamic Light Scattering: Sample Preparation, Polydispersity, and Particle Structure, M. Baalousha* and J. R. Lead, dx.doi.org/10.1021/es301167x | Environ. Sci. Technol. 2012, 46, 6134−6142
"..most samples containing nanoparticles are dynamic: aggregation or dissolution are ongoing and aggregation rates are themselves highly dependent on solution physicochemistry."
"... since Rayleigh scattering varies strongly with particle radius (6th power dependency), contaminating particles (e.g., dust) or ag- gregates can mask the signal of the nanoparticles when performing dynamic light scattering." Characterizing Manufactured Nanoparticles in the Environment: Multimethod Determination of Particle Sizes, RUTE F. DOMINGOS, MOHAMED A. BAALOUSHA, YON JU-NAM, M. MARCIA REID, NATHALIE TUFENKJI, JAMIE R. LEAD, GARY G. LEPPARD, AND KEVIN J. WILKINSON* , Environ. Sci. Technol. 2009, 43, 7277–7284
Our experience shows that we cannot rely on the DLS to measure gold nanoparticles less than 20nm in size as gnps smaller than 20nm do not scatter enough for a reliable measurement. If we take a photo of a series of gold nanoparticles of increasing size in front of a black background, we can show the lack of scattering from the smaller nanopartices. These samples appear black like the background since the incident front illumination is not scattered and simply passes through.
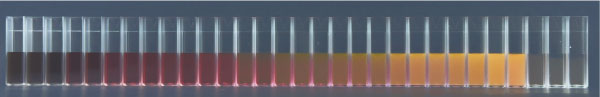
Spherical Gold Nanoparticle scattering Image Left to Right, 1.8nm to 1500nm. The sequential sizes on the smaller end are 1.8, 2.2, 3, 4, 5, 10, 15, and 20nm
Often times smaller gnps are reported by DLS as being exhorbitantly large, i.e. 1.8nm gnps are reported as 100nm and larger. The reason for this is the gnp scattering signal drop below the noise threshold, and the noise is reported as the signal.
Additionally we do not use DLS as a measurement of aggregation as it is not able to measure concentration. Instead we find UV VIS to be a great measurement for aggregation.
Finally, we do not rely on the DLS to measure thicknesses of polymer coatings as their thicknesses are 1) typically variable, varying with salt, temperature and pH and 2) we cannot expect to have a composite nanoparticle, with different materials with different refractive indices and different scattering coefficients to be accurately calculated by a model with a single refractive index and scattering coefficient input.
Conclusion
"While it was perhaps impossible to propose a “best” technique for NP sizing measurements, the most important conclusion from this work may be that the two techniques that appeared to be the most prone to artifacts were those that are most frequently used in the literature when characterizing nanoparticles, i.e., TEM following air drying of a sample and DLS. The extensive use of these techniques for measuring NP in environmental media is surprising given the extensive literature on the use (and misuse) of these techniques for environmental colloids. As was the case for environmental colloids, the authors strongly recommend the use of multiple analytical techniques and/or multiple preparation techniques when characterizing NP." Characterizing Manufactured Nanoparticles in the Environment: Multimethod Determination of Particle Sizes, RUTE F. DOMINGOS, MOHAMED A. BAALOUSHA, YON JU-NAM, M. MARCIA REID, NATHALIE TUFENKJI, JAMIE R. LEAD, GARY G. LEPPARD, AND KEVIN J. WILKINSON* , Environ. Sci. Technol. 2009, 43, 7277–7284
Go here for more information about Nanopartz Gold Nanoparticle Analysis Methods.